Community Dashboard
The community dashboard is a research and analysis project. The goal is to help the team bring rigor to its goal-setting and also to give us a means of measuring success over time.
There are many successful communities within Red Hat, Fedora, and JBoss, and those communities have been built by many different people. The Community Architecture team wants to understand how these successful communities are created, and how we ensure that every member of Red Hat, Fedora, and JBoss is capable of creating and leading a successful community.
Background
Community Biology 101
Community serves as a catalyst in Red Hat's R&D processes.
 http://www.columbia.edu/cu/biology/courses/c2005/purves6/figure06-14.jpg
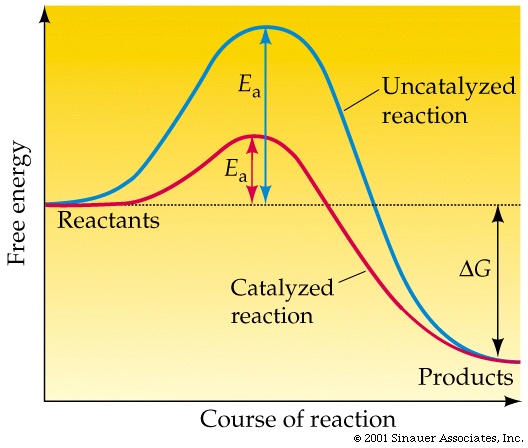
Reaction: The progress of any task from idea to reality. The task can be as simple as a one-page summary of Fedora 10 for the press, or as complicated as the feature planning process for Fedora 11. The task can be code, leadership, process documentation, testing, writing, artwork, etc.
For any reaction to complete requires some amount of energy. From a business point of view, energy, time, and money are all synonymous.
The blue curve represents a reaction that does not operate with a community-building mindset. Perhaps this is a proprietary software project, and community isn't even an option. Perhaps it is an open source upstream that is so focused on coding, it doesn't have the time to properly build a community. Either way, the amount of energy required to reach a successful end state is high.
The red curve represents a reaction that does operate with a strong community. Whether it is a Fedora sub-project, Fedora as a whole, the RPM upstream, OLPC, or an emerging technology like Cobbler or Func is irrelevant.
Note that both reactions ultimately reach the same end state. The difference is the energy required to get there. Microsoft and Red Hat can both produce an operating system. Our job is to ensure that Red Hat does so more efficiently, and community is the mechanism by which we achieve that.
Incremental vs. Continuous
We still need to define the end state of a successful community-catalyzed reaction. It has two characteristics:
- The community has a clearly identified critical path and roadmap for the future.
- The community has a clearly defined leadership structure that does not depend on any of the catalysts.
In short, the reaction will have reached critical mass and the Community Architecture team can disengage from day-to-day operations in the community, and the community will continue to grow and thrive. Perhaps certain members of the team still participate in the community because they choose to, but the community is self-sustaining. We have made ourselves redundant, and therefore free to choose a new community to catalyze.
If we have done our job correctly, the activation energy needed to reach critical mass will be lower than in an equivalent reaction that did not focus on community building.
Community EKG
EKG is a community health scanner, first conceived by Greg DeKoenigsberg and later adopted and extended by Michael DeHaan.
Its goal is to mine and present statistics about the health of various communities. Currently, its focus is on mailing lists but it has the potential to expand to other forms of contributions. Mailing lists are a proper first step because they represent the common denominator that every community must have. Furthermore, the depth (number of messages) and breadth (number of unique authors) are a decent indicator of the community's size and velocity.
EKG can process the entire history of a project, so different communities can be inserted or removed from the EKG analysis at any point in time, without the risk of data loss. Because EKG can look backward in time, it can quickly show a community's entire growth history.
Finally, EKG represents a means of processing a huge amount of raw data that is available. Our dashboard will focus on a (changing) subset of this data, but is important to know that there is an always-flowing and always-increasing river of data underneath the dashboard.
Links
Engagement Strategy
When evaluating the output of EKG, there are four main communities that we want to track:
- Fedora communities
- RHEL communities (Emerging Technologies, Red Hat upstream projects, etc.)
- JBoss communities
- Other upstreams and other distributions (to serve as a point-of-comparison)
Current Action Items
Determine the initial subset of communities to include in the dashboard.
- Poll Red Hat stakeholders (Brian Stevens and Sacha Labourey) for RHEL communities and JBoss communities that are of particular strategic importance, and ensure that EKG is tracking them.
- Create a subset of Fedora communities that Community Architecture has engaged with over the past year, or that we consider of specific importance to the overall health of Fedora. Make sure that EKG is tracking them. (Max has already done this and submitted a patch to EKG.)
Conduct a time-based analysis of these communities, looking back as far as possible.
- New action items will fall out of this analysis.
- In the case that certain communities that have been identified as strategic appear that they could use some community-building assistance, reach out to the leadership of those communities. Begin a constructive (not critical) conversation, and see if they are interested in working with us.
- When we discover thriving communities that we have not previously engaged with directly, speak to their leaders and perhaps learn some new tricks, and build relationships.
Disclaimer
It is critical to recognize that the end state of every community is not the same, and therefore the engagement model is not necessarily the same for each community. It is also worth noting that some communities will neither need nor want to work with the Community Architecture team.
Measuring Success
During Friday's meeting, let's look at a few examples on the EKG output page, and talk through the manner in which our team looks at different lists, and the statistics around them, and draws conclusions. This will be a useful group exercise.
In particular:
- cobbler
- epel-devel-list
- et-mgmt-tools
- fedora-devel-list
- fedora-olpc-list
- freeipa-devel
- func-list
- genome-list
- jboss-development
- jbossws-dev
- libvir-list
- ovirt-devel
- spacewalk-devel
- spacewalk-list
- stateless-list
Metrics
FIXME: This section is incomplete. It is mostly just notes jotted down, rather than even rough-draft level material.
We analyze the historical data for the communities that we have focused on this past year, and see what kind of improvements we have made.
We look at communities that we were focused on in the past but felt we had finished our catalyst job for, and see how well maintenance is going.
Furthermore, we look at the largest deltas (either positive or negative) each quarter, as success stories or potential red flags for attention.