< Eclipse
m (→Features) |
m (→Features) |
||
| Line 18: | Line 18: | ||
'''Call Graph''' | '''Call Graph''' | ||
Clicking on the 'function callgraph' will render a visual representation of the functions that were called while running the executable | Clicking on the 'function callgraph' will render a visual representation of the functions that were called while running the executable. | ||
[[File:Stapgraph_regular_view_scaled.png]] | [[File:Stapgraph_regular_view_scaled.png]] | ||
This feature comes with a few different display options and various other information such as the percentage time spent in a function and the number of times a function is called. All of these settings can be changed and accessed through the SystemTap view menu. | |||
<center>[[File:Stapgraph menu.png]]</center> | |||
Revision as of 20:37, 31 July 2009
Installation
Installation of the Eclipse SystemTap plugin will be done through the yum repository. Users can simply type from command-line :
'yum install systemtap-eclipse'
General Usage
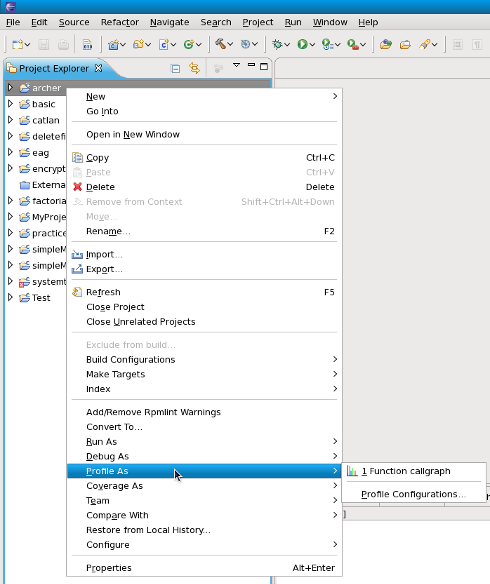
All the SystemTap plugins are accessible from the C/C++ perspective, by right clicking on C/C++ source file in the editor view, or by right clicking on the corresponding binary in the package explorer view.
Features
Call Graph
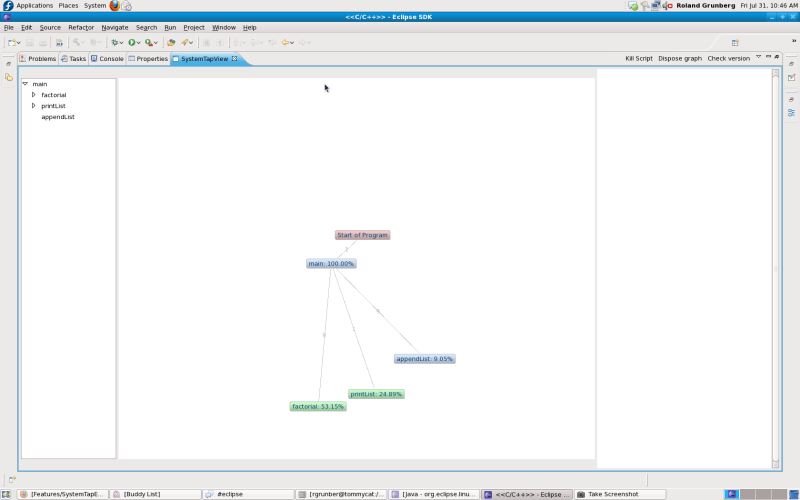
Clicking on the 'function callgraph' will render a visual representation of the functions that were called while running the executable.
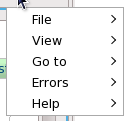
This feature comes with a few different display options and various other information such as the percentage time spent in a function and the number of times a function is called. All of these settings can be changed and accessed through the SystemTap view menu.
File IO Monitor
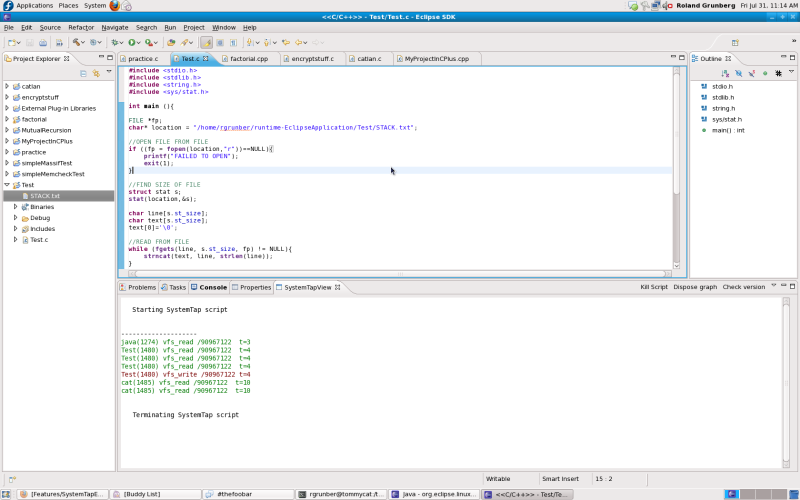
Clicking on 'File IO Monitor' will prompt the user to specify the location of a file. After this, any read/write calls to that file will be shown with the process that made the read/write call, and the time at which this happened.
Since this script can run for as long as is necessary, the user must manually stop the script by clicking on the 'kill script' button in the SystemTap view.
Function Trace
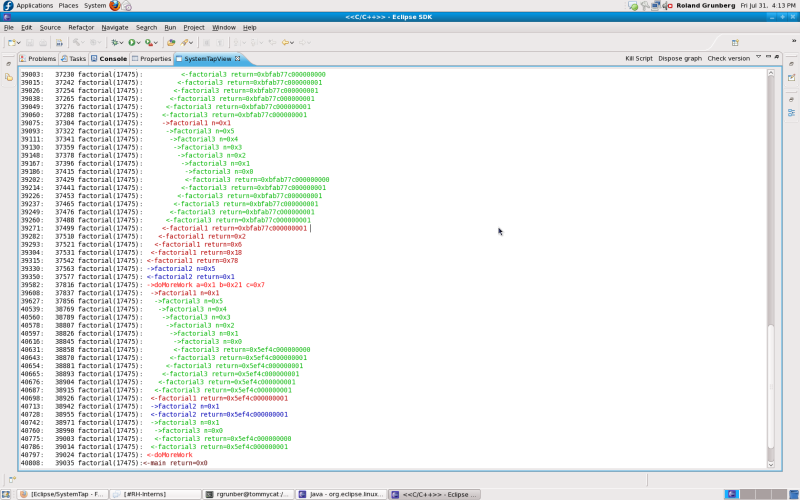
Clicking on 'Function Trace' will render a text-based representation of the series of function calls, and returns that were executed.
Script Launch Wizard
Clicking on the 'Launch Wizard' will help the user in launching custom made SystemTap scripts on any chosen C/C++ executable.
- TODO : finish this

