A number problems have emerged with the steady growth of Fedora over the last years. While some of the scalability issues in RPM and Yum have already been addressed the UI issues are still to be solved.
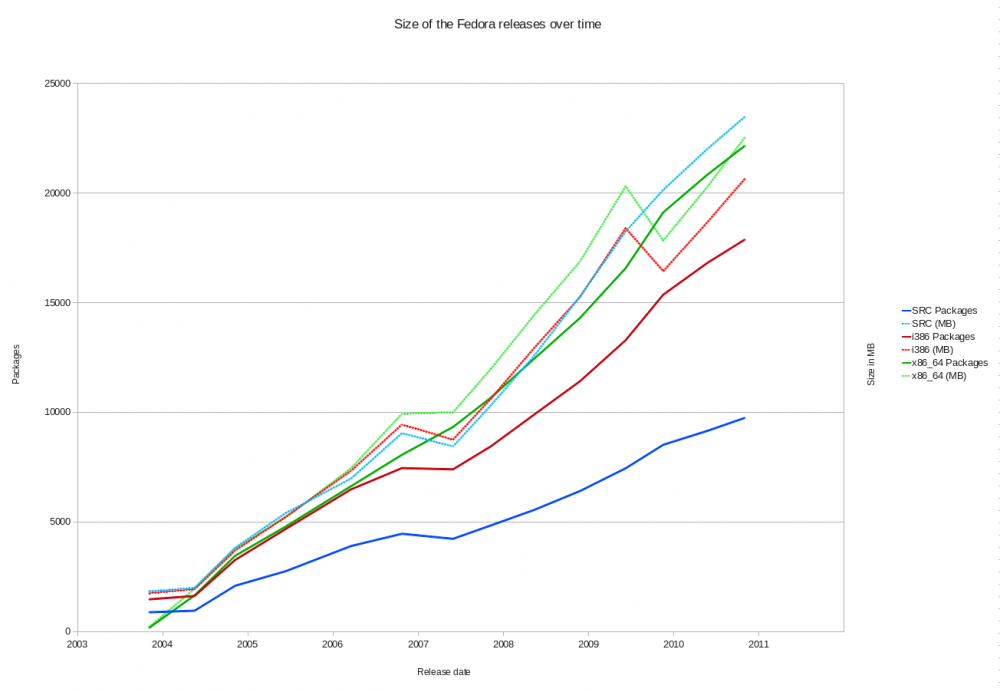
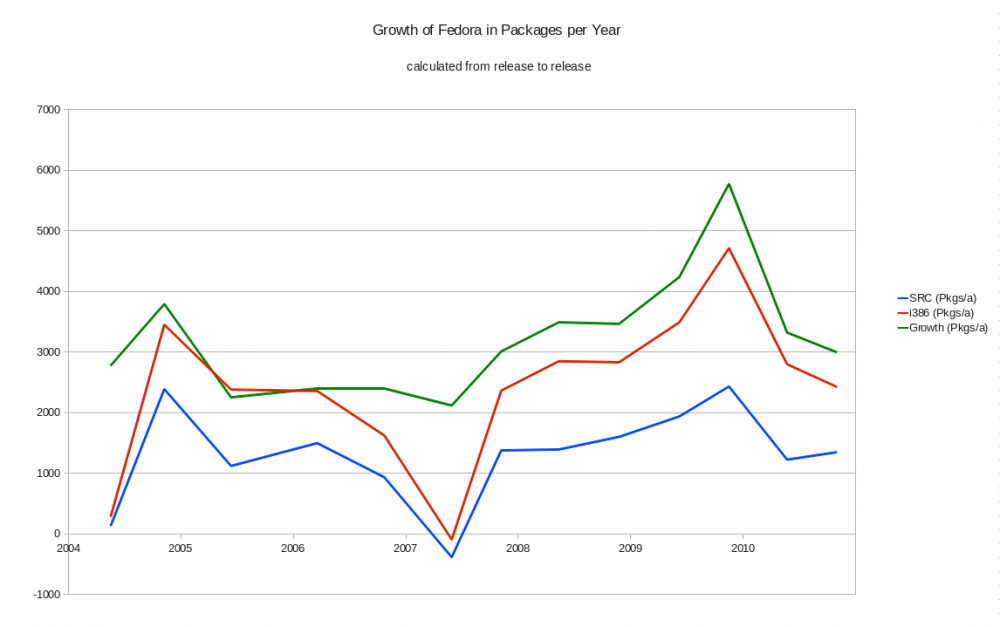
To better understand the size of Fedora and the way it growths I compiled a little spreadsheet (File:Fedora-Statistics.ods) to generate the following charts (Thanks to Phil Knirsch for organizing the data of some of the older releases!):
The dashed lines show the size of all the binary packges. The continuous lines the number of packages. The numbers up to mid 2007 include Extras. You can see how some of the packages got excluded when merging Extras. End 2009 the size of the binary packages drop due to the change from gzip to xz compression. This has bought us only about one year in growth...
This shows the growth per year. Note that the growth data point appears on release date although it should actually be shown through out the development period before. The actual graph is not providing that much information. More interesting is the general order of magnitude of the past and current growth.
Conclusions
My personal conclusions are this:
Fedora's growth is impressive. It is not exponential, though. As the size has already doubled several times further doubling with be a much more rare event in the future. Growing to 50,000 packages or 50GB size will still take several years. Building tools and infrastructure to be able to deal with 100,000 packages and 100GB size gives us safety over a period of time that is beyond our sight (more than 10 years).
Although I cannot back this up with scientifically rigid numbers my impression is that the size of a typical installed machine has not grown in the same way the distribution has. In RHL times a installation might have 800 packages. today a "typical" installation may have 1500 to 2500 packages. So the fraction of the distribution actually installed on a system is getting smaller and smaller.
The actual numbers are heavily influenced by policy decisions. Packaging things differently or excluding a special kind of software gives visible impact to the graphs easily. The general trend is pretty much unaffected, though. Let's see how long it lasts...


